Insight note · 19 November 2026
US machine-tool orders: 81% more units in September 2026 than September 2024
Anvilmore Research Team
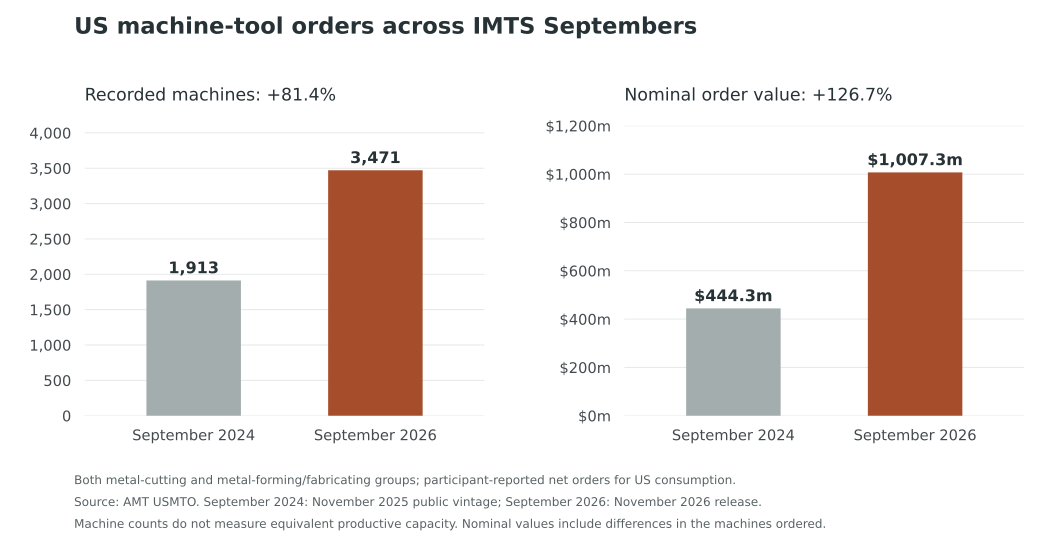
September 2026 recorded roughly four-fifths more US machine-tool orders by unit count than September 2024, the previous International Manufacturing Technology Show (IMTS) September. For suppliers assessing the scale of equipment purchasing, that is a different measure from the much larger dollar expansion[1][2].
Across the two published machine groups, the combined net count rose from 1,913 to 3,471: an 81.4% increase. Nominal order value rose 126.7%, from $444.3 million to $1,007.3 million. These calculations compare AMT’s November 2026 release with the September 2024 observation printed in its November 2025 release[1][2].
The figures come from the USMTO programme run by AMT — The Association For Manufacturing Technology, an industry association. They cover net new orders for US consumption reported by participating companies, including domestic and imported machinery[1].
A larger count across the same show calendar
Both Septembers coincided with IMTS. Comparing them retains that calendar feature, instead of comparing a show-year September with the intervening September. It does not isolate the show’s causal contribution, seasonally adjust the series or hold economic conditions and reporting participation constant[1][3].
The combined result includes both published groups: cutting machines and metal forming/fabricating machines. Cutting accounts for 3,434 of the latest 3,471 units. Forming/fabricating rose from 17 to 37 units, so its larger percentage increase should not suggest equal weight in the combined expansion[1][2].
The historical publication matters. AMT’s initial November 2024 release recorded 1,949 units for September 2024, compared with 1,913 in the later public observation. Using that initial count gives 78.1% growth to September 2026. The measured increase remains close to four-fifths under either archived baseline. The comparison uses those recorded public vintages; later revisions may change the precise percentages[2][3].
The dollar increase exceeds the machine increase
The difference between 126.7% nominal-value growth and 81.4% unit growth corresponds to a 24.9% increase in aggregate mean value per recorded unit. That ratio is sensitive to the mix of machines ordered. It does not measure like-for-like machine prices, inflation or equivalent production capacity[1][2].
The records concern orders, not deliveries, and the machines counted have different capabilities[1].
The show-to-show count supports describing a much larger recorded machine market, even using the earlier baseline. It does not support using the dollar growth rate as equivalent equipment volume, or treating the aggregate as an individual supplier’s sales outlook.
Sources
[1] AMT, November 2026 USMTO release, 9 November 2026: PDF p. 1, high-count and IMTS context; p. 3, programme scope; p. 4, national unit/value table.
[2] AMT, November 2025 USMTO release, 10 November 2025: PDF p. 3, September 2024 unit/value row. Percentage comparisons and aggregate mean are calculated from the cited tables.
[3] AMT, November 2024 USMTO release, 11 November 2024: PDF p. 1, IMTS calendar; p. 5, initial September 2024 national units.