Analysis · 30 October 2026
US transformer prices showed the 2021 squeeze as it happened, but not its peak or its easing
A monthly US producer price index for transformers surged with the 2021 lead-time squeeze and showed it months before the first published lead-time figures found. It also fired in 2018 with no squeeze documented in 2019, and missed the peak and the easing.
Anvilmore Research Team
Data as of 30 October 2026.
Utilities, renewable developers and data-centre builders set energisation dates around transformer deliveries. In February 2025 the International Energy Agency (IEA) reported, from an industry survey, that large power transformers could take up to four years to secure worldwide, and that average lead times had almost doubled since 2021 [1]. For a procurement or project lead, the question is whether anything public signals a change in lead times before a supplier's quote does.
This analysis compares a monthly US producer price index for transformers with dated lead-time figures published between 2014 and 2026, and checks one importing market's data, Australia's. The index is not a reliable leading indicator. Its 2021 surge arrived in the same months as the distribution transformer squeeze. Against the approximately dated large power transformer upturn, it came from about the same time to roughly a year earlier. Its value was speed: it showed the squeeze many months before the first published lead-time figures found. It also fired in 2018 with no squeeze documented in 2019, and gave no warning of the peak or the easing.
What the index measures
The index is the US Bureau of Labor Statistics producer price index for transformer manufacturing [2]. It measures US producer prices for power, distribution and specialty transformers combined. It is not a purchase price outside the US, and it cannot separate one class from another. Its use here is that it is monthly; published lead-time figures are irregular.
The index rose 3.6% from January 2019 to December 2020, then 58.3% from January 2021 to July 2022. It rose 7.4% over the 33 months from December 2022 to September 2025, before stepping up 4.0% in October 2025 and another 4.0% in July 2026 [2]. Values from June 2026 are preliminary and can be revised for four months after release.
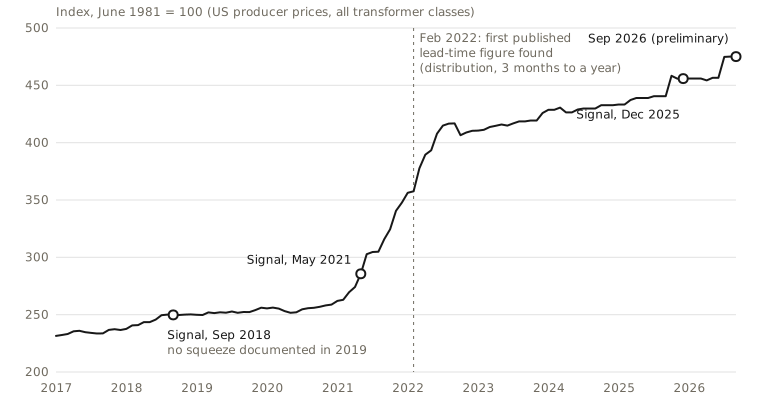
US producer price index for transformer manufacturing (power, distribution and specialty transformers combined), monthly, not seasonally adjusted. Markers show the four rule confirmations; no squeeze is documented in 2019 after the September 2018 signal. The dashed line marks February 2022, the first published lead-time figure found (distribution, three months to a year). Values from June 2026 are preliminary. Source: US Bureau of Labor Statistics.
The rule and the record it was tested against
Testing the index needs a rule for when it "fired". The rule was set before any comparison with lead times: a year-on-year rise of at least 5%, held for three consecutive months. It confirmed four times: September 2018, May 2021, December 2025 and September 2026, the last on preliminary values. A 10% threshold would have removed the 2018 firing, but it was found only after seeing the data, so it is not used.
Each firing was set against dated lead-time figures. They came from US Department of Energy (DOE) studies [3][4][5], a draft National Infrastructure Advisory Council (NIAC) report [6] and the American Public Power Association (APPA) [7][8]. Others came from T&D World trade-press reporting [9][10], Wood Mackenzie [11][12][13] and the IEA [1]. Distribution, large power and generator step-up (GSU) transformers were kept in separate series. The gap was measured two ways: from the period each source says lead times began to lengthen, and from the date the first lead-time figure was published.
The 2021 surge arrived with the squeeze
The index first rose 5% year on year in March 2021, and the rule confirmed in May 2021. Distribution lead times began lengthening in the same months. APPA's 2022 survey of 95 public power utilities found that supply stopped meeting demand "beginning in 2021", with lead times of about 2–3 months before 2021 against about 12 months in 2022 [8]. The utility JEA dated its disruptions to early 2021 [10]. An Iowa utility's transformer order, placed at the start of 2021, arrived in October, when it usually took a few months [7]. Whether measured from the first 5% reading or the May confirmation, the index moved within a few months either side of that start: about the same time.
For large power transformers the dating is approximate. A consultant quoted by T&D World in July 2022 said lead times had started to "creep up" about a year earlier, so around mid-2021 [9]. Wood Mackenzie, in commentary NIAC dates to November 2023, said transformer lead times had been rising "for the last 2 years" from around 50 weeks in 2021, which puts the start in late 2021 or early 2022 [6][11]. So the index's rise came from about the same time as the large power upturn to roughly a year before it. That is one episode, set against the 2018 false alarm.
It was faster than published figures
Measured from the May 2021 confirmation, the index moved nine months before the first dated distribution figure published in the sources reviewed: APPA's magazine on 9 February 2022, describing a lead time going "from three months to a year" [7]. It was 14 months before the first large power figure in those sources: T&D World on 12 July 2022, reporting about 38 months at one relatively large US manufacturer [9]. Both gaps are upper bounds. APPA surveyed its members from November 2021 and those results were not found, and searches turned up no lead-time figure published during 2021.
These gaps measure how slowly lead-time figures reach print, not how early the market turned. By the time the index moved, distribution lead times had already begun to lengthen.
The 2018 firing was a false alarm
Year-on-year rises of 6.6–7.1% in July to September 2018 confirmed the rule in September 2018. The sources reviewed document no lead-time extension in 2019. DOE wrote in 2024 that before COVID-19 a large power transformer could be ordered with less than a year's lead time [5]. DOE's December 2022 paper put US distribution waits at 3–6 months before 2022 [4], and the NIAC draft contrasted 2024 waits with "just months as recently as 2020" [6]. These are retrospective statements, not a series for those years.
The 2018 rise came in the year US Section 232 tariffs took effect. Wood Mackenzie says US imports of grain-oriented electrical steel, a key transformer input, fell after an initial rush once those tariffs took effect [13]. Linking that to the 2018 price rise is our inference. If it holds, it shows input costs lifting prices without order books filling.
The US index gave no warning of the peak or the easing
Wood Mackenzie said in June 2024 that US power and GSU lead times had tripled since 2021, to about 150 weeks after receipt of order, combined, over the two quarters before 27 June 2024 [12]. On the same measure, in the first quarter of 2025 they stood at 138.4 weeks for power transformers and 147.7 for GSU units, and in the second quarter at 128.0 and 143.4 [13]. On that basis, large power lead times peaked around 2023–24 and held at roughly 2.5–3 years before easing slightly in 2025.
No 2022–23 figure on this measure was read, so the peak quarter is unknown. Over the year to March 2025 the index rose 1.5%, and when the second-quarter easing appeared it was 2.3–3.0% higher than a year earlier [2].
Distribution followed a different path. On the same measure, pad-mounted distribution units rose to about 75 weeks over the same two quarters, and pole-top lead times had started to ease [12]. In 2025 pad-mounted units sat at 19.9–30.0 weeks in the first quarter and 24.0–46.4 weeks in the second, so they lengthened again, but stayed far below that level [13]. Throughout, the index stayed above its year-earlier level.
The classes moved on different paths, and in the first half of 2025 sat far apart: pad-mounted units at 19.9–46.4 weeks, power and GSU units at 128.0–147.7 [13]. A combined index cannot say which queue a buyer is in.
One importing market's data added no early warning
Annual UN Comtrade statistics give Australia's import values for three size bands of liquid-dielectric transformers [14]; the UK, Europe, Canada, the Gulf and New Zealand were not tested. The statistics cannot serve as an early price signal: the data is annual, and the net weights needed to turn values into a price per kilogram are UN estimates rather than reported figures, with none given from 2023.
There is no Australian lead-time series to test import values against. The only Australian figure in this record comes from AusNet, announcing a large power transformer supply agreement on 3 July 2026. It said global demand exceeding manufacturing capacity is driving lead times to "over two and a half years", without defining the lead time [15].
What remains open
The rule fired again in December 2025 and September 2026, after the two 4.0% steps. Whether US lead times lengthen again is untested: the latest class-specific US figure reviewed is for the second quarter of 2025.
What a firing tells a buyer
Prices rose and stayed up while lead times peaked and eased, so a flat index is no sign that slots are opening: only a class-specific quote or benchmark shows the queue a project is in. A firing is not a forecast either. Of the two tested here, one came with a squeeze and one did not. Its use is to a buyer not yet in the queue, such as an owner planning a project with no live quote, because in 2021 the index showed the US squeeze faster than published US figures did. When the rule fires, as it did in December 2025 and September 2026, that buyer should check current lead times for the class being bought and seek a quote early.
Sources
- Building the Future Transmission Grid: Executive summary, International Energy Agency, February 2025. https://www.iea.org/reports/building-the-future-transmission-grid/executive-summary
- PPI industry data for Electric power and specialty transformer mfg, not seasonally adjusted, US Bureau of Labor Statistics, data extracted 29–30 October 2026 (June–September 2026 preliminary). https://data.bls.gov/timeseries/PCU335311335311
- Large Power Transformers and the U.S. Electric Grid (April 2014 Update), US Department of Energy, April 2014. https://www.energy.gov/sites/default/files/2014/04/f15/LPTStudyUpdate-040914.pdf
- The Supply Chain Crisis Facing the Nation's Electric Grid, US Department of Energy Office of Policy, 12 December 2022. https://www.energy.gov/sites/default/files/2022-12/The%20Supply%20Chain%20Crisis%20Facing%20the%20Nations%20Electric%20Grid_12.12.22.pdf
- Large Power Transformer Resilience: Report to Congress, US Department of Energy, July 2024. https://www.energy.gov/sites/default/files/2024-10/EXEC-2022-001242%20-%20Large%20Power%20Transformer%20Resilience%20Report%207-10-24.pdf
- Addressing the Critical Shortage of Power Transformers to Ensure Reliability of the U.S. Grid (draft, pre-decisional), National Infrastructure Advisory Council, June 2024. https://cisa.gov/sites/default/files/2024-06/DRAFT_NIAC_Addressing%20the%20Critical%20Shortage%20of%20Power%20Transformers%20to%20Ensure%20Reliability%20of%20the%20U.S.%20Grid_Report_06052024_508c.pdf
- "Shortage Changed: How Utilities Are Adapting to Supply Chain Issues", Public Power, American Public Power Association, 9 February 2022. https://www.publicpower.org/periodical/article/shortage-changed-how-utilities-are-adapting-supply-chain-issues
- Public Power Distribution Transformer Demand Survey Summary, American Public Power Association, October 2022; and "APPA Survey of Members Shows Distribution Transformer Production Not Meeting Demand", Public Power, 12 October 2022. https://www.publicpower.org/system/files/documents/2022%20Public%20Power%20Distribution%20Transformer%20Demand%20Survey%20Summary%20PUBLIC.pdf; https://www.publicpower.org/periodical/article/appa-survey-members-shows-distribution-transformer-production-not-meeting-demand
- "Transformative Times: Update on the U.S. Transformer Supply Chain", T&D World, 12 July 2022. https://www.tdworld.com/utility-business/article/21243198/transformative-times-update-on-the-us-transformer-supply-chain
- "No Easy Answers: Transformer Supply Crisis Deepens", T&D World, 23 February 2023. https://www.tdworld.com/substations/article/21258955/no-easy-answers-transformer-supply-crisis-deepens
- Supply shortages and an inflexible market give rise to high power transformer lead times (opinion), Wood Mackenzie, page dated 2 April 2024. https://www.woodmac.com/news/opinion/supply-shortages-and-an-inflexible-market-give-rise-to-high-power-transformer-lead-times/
- 4 years into a difficult transformers market in the US: is there a potential end in sight? (opinion), Wood Mackenzie, 27 June 2024. https://www.woodmac.com/news/opinion/4-years-into-a-difficult-transformers-market-in-the-us-is-there-a-potential-end-in-sight/
- Making the connection: meeting the electric T&D supply chain challenge, Executive Summary, Wood Mackenzie with American Clean Power, September 2025 (copy hosted by POWER magazine). https://www.powermag.com/wp-content/uploads/2026/01/making-the-connection-executive-summary-september-2025.pdf
- UN Comtrade Database, international merchandise trade statistics: Australia, annual imports of liquid-dielectric transformers, 2017–2025, United Nations Statistics Division, retrieved 30 October 2026. https://comtradeplus.un.org/
- AusNet locks in critical transformer supply to power Victoria's energy transition, AusNet, 3 July 2026. https://www.ausnetservices.com.au/news/ausnet-locks-in-critical-transformer-supply-to-power-victorias-energy-transition